My Stats
The My Stats screen gives you a personal dashboard of your chore history, personal records, charts, and family-wide numbers — all in one place.
How to Access
Section titled “How to Access”Open Account from the bottom navigation bar, then tap My Stats.
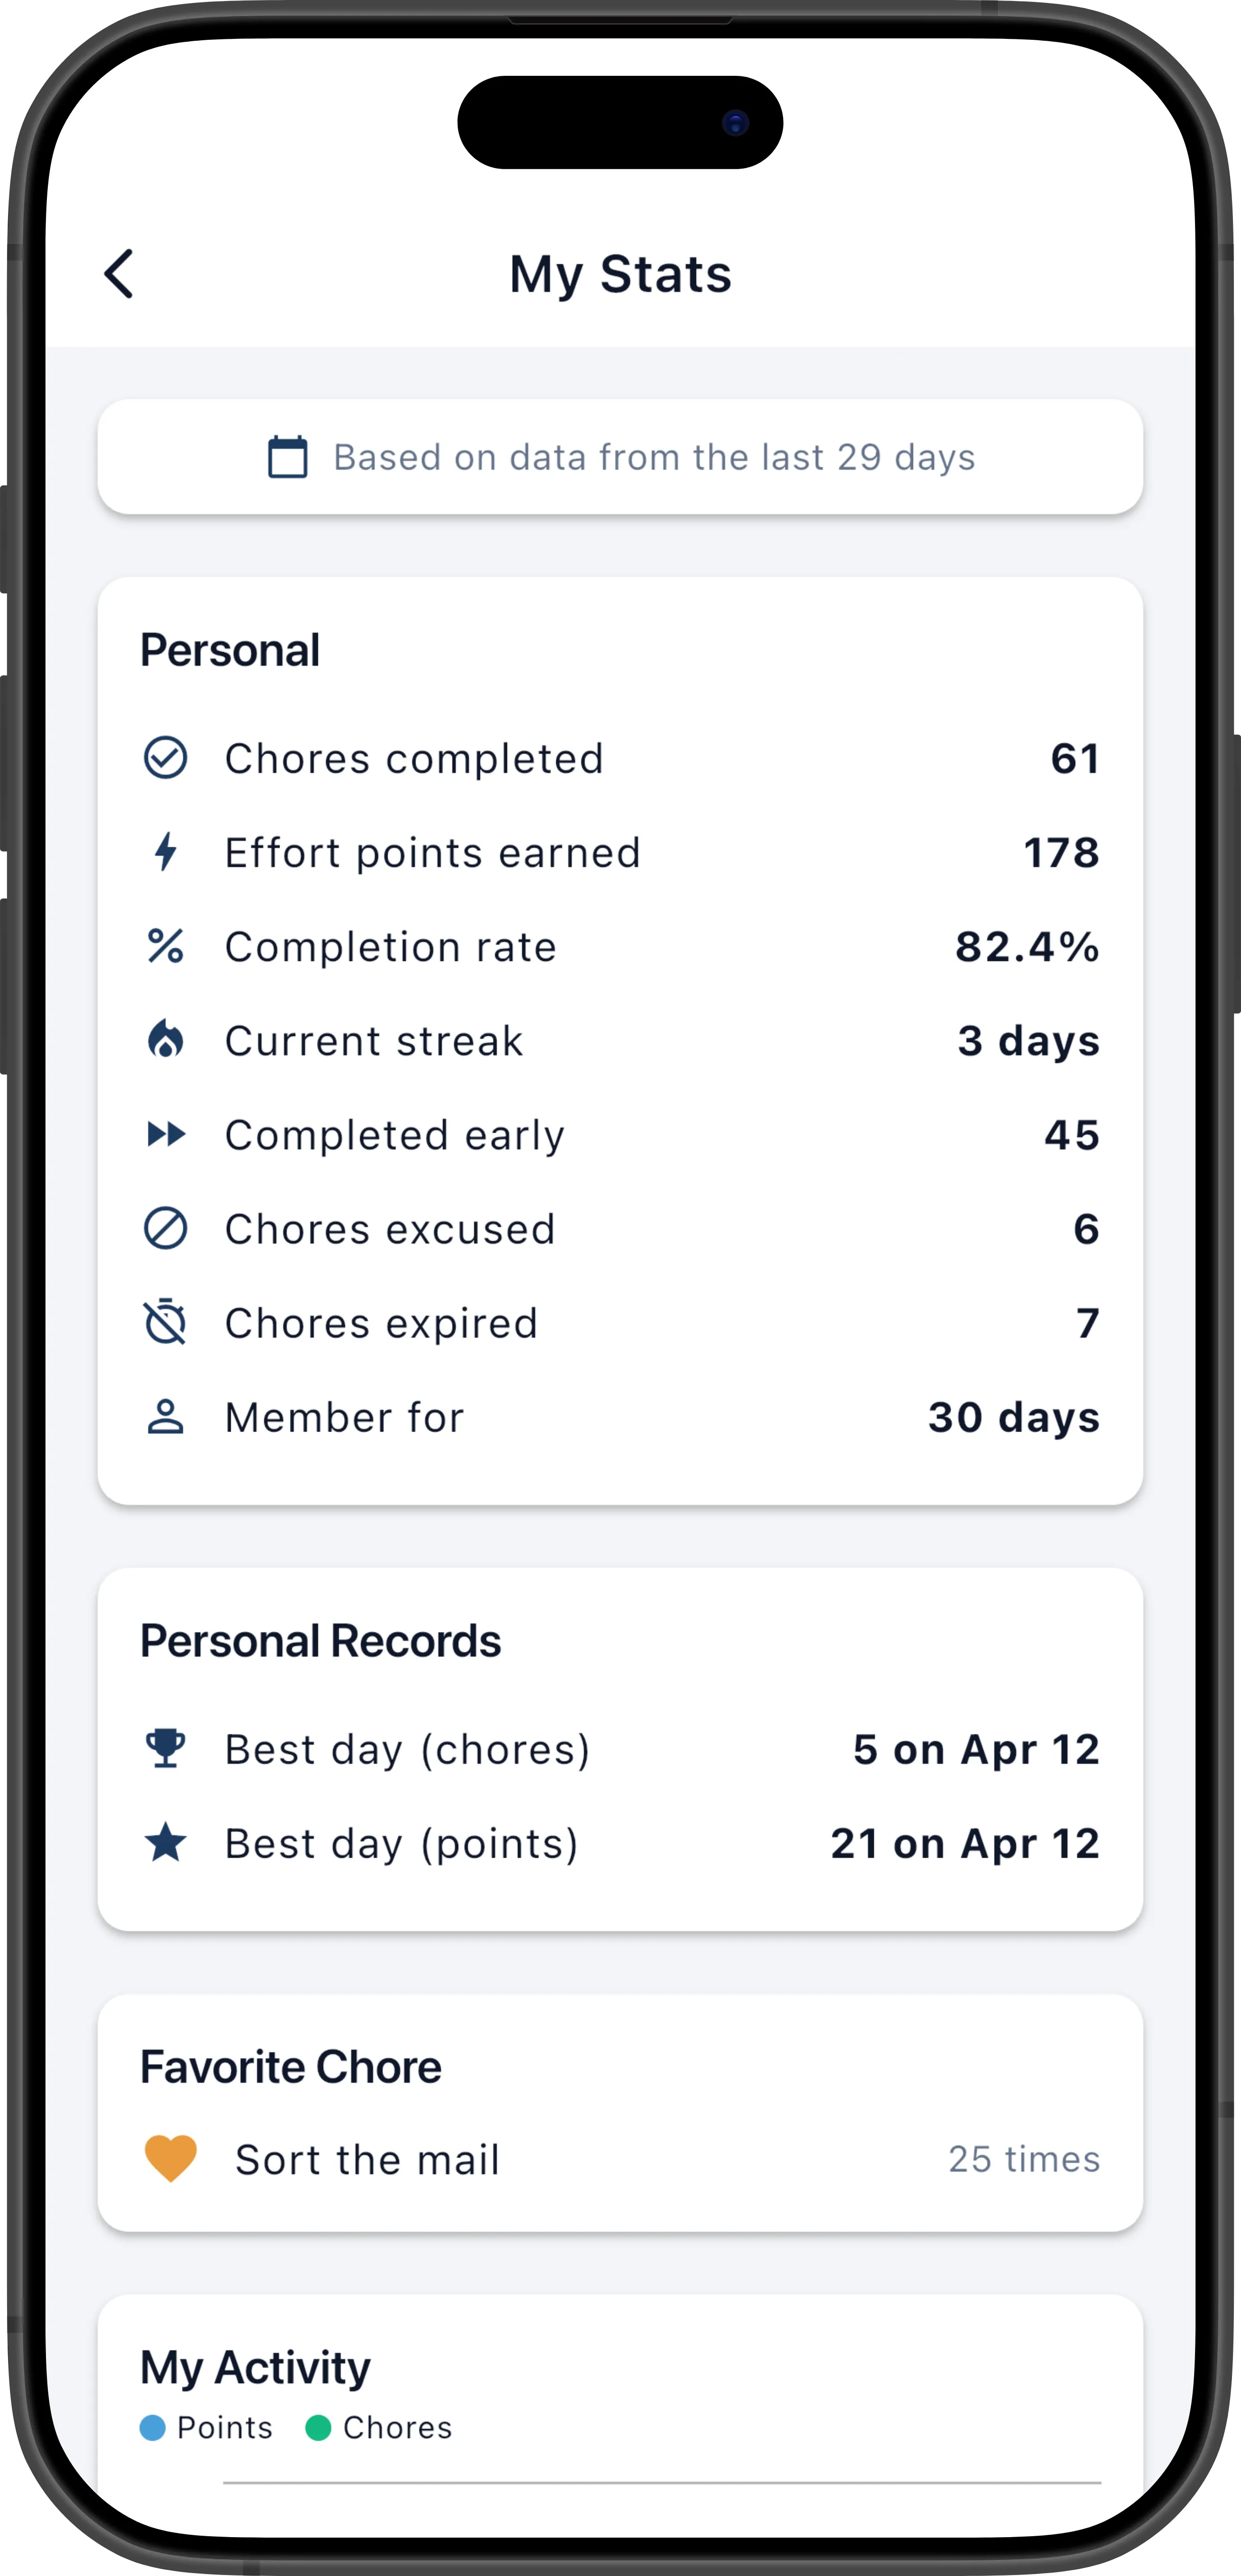
History Window
Section titled “History Window”A banner at the top of the screen shows how far back your stats reach: “Based on data from the last N days.” The window depends on your family’s subscription tier:
- Free — 1 month
- Pro — 3 months
- Max — 1 year
If your family is not on the Max plan, a Get more link appears next to the banner so you can explore upgrade options.
Personal Stats
Section titled “Personal Stats”The first card displays your individual performance numbers:
| Stat | Description |
|---|---|
| Chores completed | Total number of chores you finished on time in the history window |
| Completed late | Number of chores you finished after their due date (only shown if greater than zero) |
| Effort points earned | Sum of effort points from all completed chores (on-time and late) |
| Completion rate | Percentage of assigned chores you completed (completed / assigned) |
| Current streak | Consecutive days you completed every assigned chore on time (or had them excused) |
| Longest streak | Your all-time best consecutive-day streak |
| Chores expired | Number of chores that expired past their due date (only shown if greater than zero) |
| Chores excused | Number of chores your manager excused (only shown if greater than zero) |
| Photos uploaded | Number of completion photos you submitted (only shown if greater than zero) |
| Member tenure | How long you have been a member of this family, in days |
Personal Records
Section titled “Personal Records”If you have any standout days in your history, a Personal Records card shows:
- Best day (chores) — the date and count of the most chores you completed in a single day
- Best day (points) — the date and total of the most effort points you earned in a single day
This card only appears when at least one record exists.
Favorite Chore
Section titled “Favorite Chore”Your most-completed chore is highlighted with its name and how many times you completed it. This section only appears when you have completed at least one chore in the history window.
Daily Activity Chart
Section titled “Daily Activity Chart”A line chart plots two metrics over the last 30 days of data:
- Blue line — effort points earned per day
- Green line — chores completed per day
Tap or hover on any point to see a tooltip with the exact values for that day. This chart only appears when there are at least two days of data to plot.
Chores by Day of Week
Section titled “Chores by Day of Week”A bar chart shows how many chores you completed on each day of the week (Monday through Sunday). The busiest day is highlighted in orange, with a message like “Most productive on Wednesdays!” displayed above the chart.
Tap any bar to see a tooltip with the exact chore count and effort points for that day.
Family Stats
Section titled “Family Stats”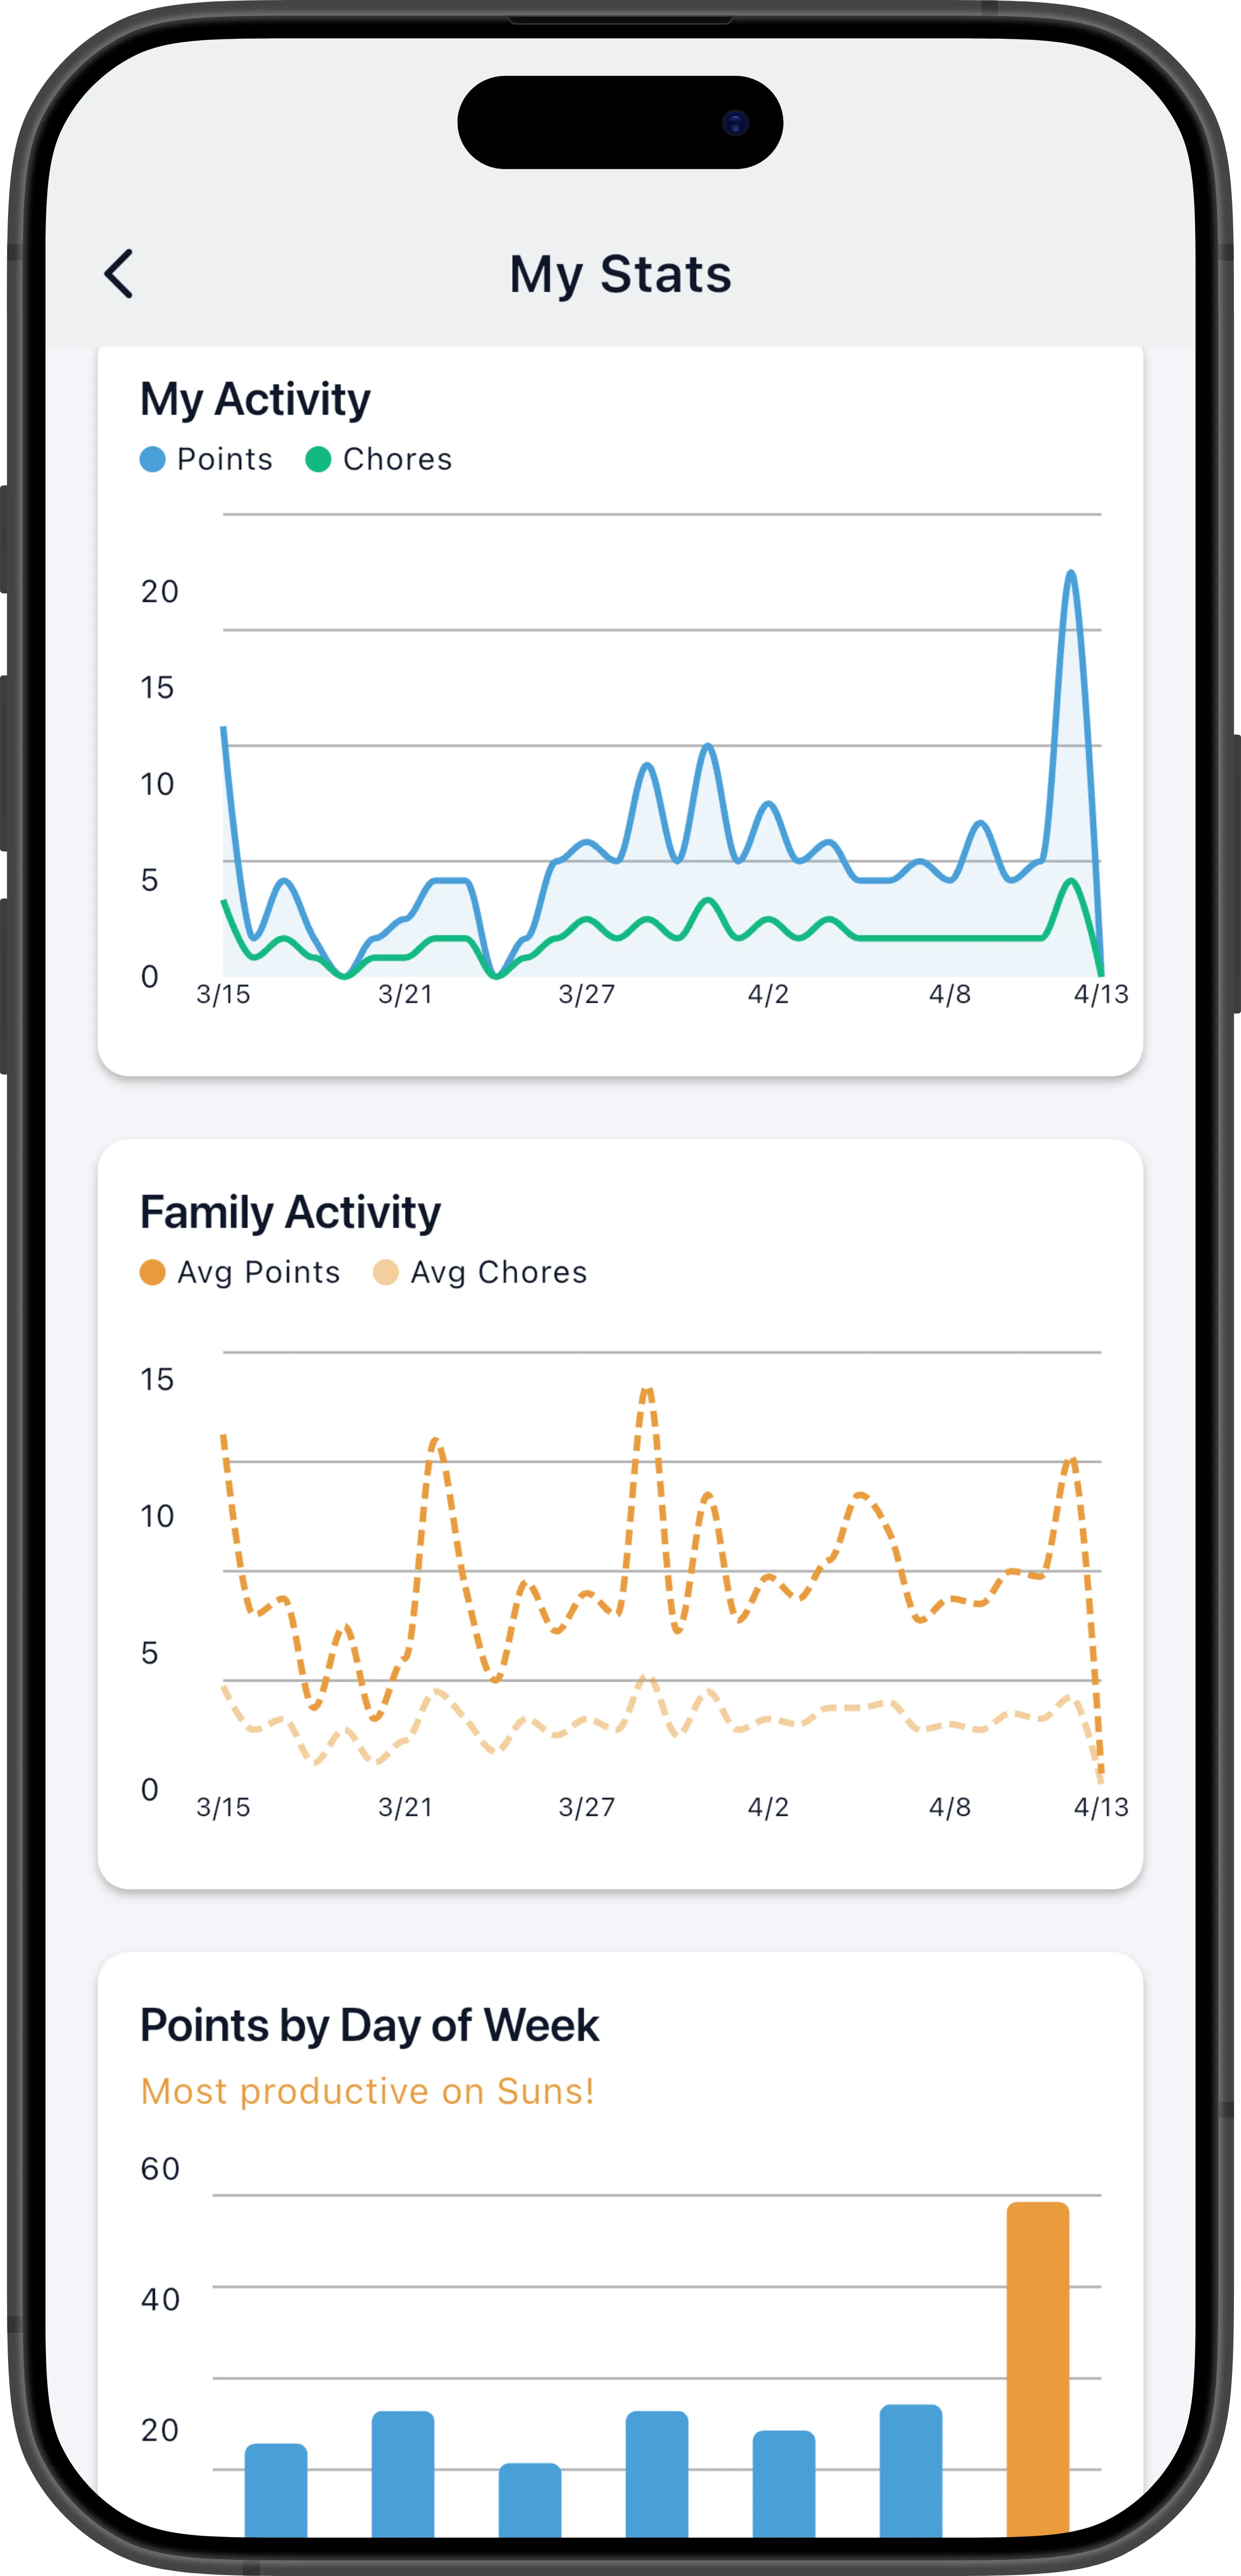
The Family card shows how your entire family is doing collectively:
| Stat | Description |
|---|---|
| Total chores completed | Combined chore completions across all family members |
| Total effort points | Combined effort points across all family members |
| Family completion rate | Percentage of all assigned chores that were completed family-wide |
| Perfect days | Number of days where every single assigned chore across the family was completed |
Pull to Refresh
Section titled “Pull to Refresh”Pull down anywhere on the stats screen to reload all data with the latest numbers.
Related
Section titled “Related”- Goals & Progress — set personal goals and track your streaks
- Leaderboard — see how you rank against other family members